Menu
Community /Pin to ProfileBookmark
please use code tags when posting code:` or triple backticks. I edited your posting accordingly.
I didn't know about vis.js till now but after having a short look at the docs and the examples I suspect that the element "start" is missing in your data. Obviously the timeline graph depends on it.
If this doesn't help, please post your json, a section containing a few elements would be sufficient.@Sempervivum#1638314 thanks so much, yes i dont have start. where will i get it? I did ran on nuget command on my VS, when i expand the folder under VIS nothing of start.Please give some info about the semantics of your data: What does it contain? Apparently you provide the JSON yourself. If you intend to display it as a timeline a start time is essential. Maybe there is a time but named differently? @Sempervivum#1638522 i am doing MVC and using Ado.net from local dababase, have a logic that calls this from controller, the issue is on the front end. Should i share the logic for back end?@Sempervivum#1638522
When writing "Please give some info about the semantics of your data: What does it contain?" I didn't mean the code but the JSON or data. Which information does it contain? Is there some info about the time under a different name?
Please post some sample data. @Sempervivum#1638528 Well under VIS folder there some js files, there is no data. Is there something else should look for? The data gets pull from the database on my application, dont have json file on my project.
@Sempervivum#1638532
I am still getting same error, inspect it and getting same error. What could i be missing?This was not a fix but should give us some info about the data being received by the server. Open the console and post what's output, no matter if there is still an error. @Sempervivum#1638535
This what i get from the console
Description: "ShopFloor AMS Incident Report"
Incident: 1
Resources: "Racs"
Start_Date: "/Date(1631138400000)/"
Timestamp: "/Date(1632369600000)/"
id: "88b814cb-0a7c-4656-841e-77e3d7bd16da"
[[Prototype]]: Object
constructor: ƒ Object()
hasOwnProperty: ƒ hasOwnProperty()
isPrototypeOf: ƒ isPrototypeOf()
propertyIsEnumerable: ƒ propertyIsEnumerable()
toLocaleString: ƒ toLocaleString()
toString: ƒ toString()
valueOf: ƒ valueOf()
__defineGetter__: ƒ __defineGetter__()
__defineSetter__: ƒ __defineSetter__()
__lookupGetter__: ƒ __lookupGetter__()
__lookupSetter__: ƒ __lookupSetter__()
__proto__: (...)
get __proto__: ƒ __proto__()
set __proto__: ƒ __proto__()
1:
Description: "ShopFloor AMS Incident report"
Incident: 2
Resources: "Tracking Client"
Start_Date: "/Date(1631138467000)/"
Timestamp: "/Date(1631707200000)/"
id: "d781b787-a2e7-4a26-bf92-70f8aa797fde"
[[Prototype]]: Object``
@Sempervivum#1638537 on my console when debug, type console.log(response);
output show begin response
end response@Sempervivum#1638537 i have put this logic on index.cshtml, does it has to be seperate file of its own? Maybe it could be reason why this is not running, i could be missing somethingThis is helpful, apparently we have to convert the response so that it will match the format being required by visjs. I gonna figure this out.
@Sempervivum#1638545
Thanks so much mate, you made my day, it does load the data without any issue. Will amend my local data fields from the database(extra fields like year and username) without having any issues. It works mate@Sempervivum#1638548 last question, on my UI how do i change timestamp, it shows 09 September 00:001 and my next item now to work on the total hours to be displayed on my UI
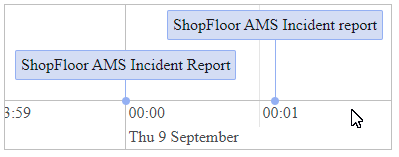
For me the output of vis.js for the sample data you posted looks like this:
 
@Sempervivum#1638550
I checked on my local database, Start_Date record is datetime and did the same on model its datatype_. I do see on your output you have correct order of day and date, what could i be missing? Share your full vis js correctly took the newest one you posted. I could be missing some information.
Does this mean that your page is displaying the graph in a different way? Maybe we are using different versions of vis.js. I included it from CDN, my complete test file is:
@Sempervivum#1638552 yes the graph does display but there is not enough information. Ignore the error i had a fix using json, to me mine does not show day, date it is there. Do you know how to calculate hours? I saw this on stackoverflow, but trying somework around to it.
https://stackoverflow.com/questions/44286720/vis-js-show-only-business-hours-in-timeline Unfortunately from your latest posting I do not understand what the remaining issue is.
The link on stackoverflow describes how to restrict the graph to business hours. Is this what you need? @Sempervivum#1638558 I want to implement total hours worked on a given task to be display on UI, hope make sense.
I have tried to use this logic and was unable to achieve this result, perhaps i need your help on this one.
This I understand. However more questions arise: What date and time should be used when the work is distributed over some days? Note that the timeline graph depends on the field` which is datetime. I wonder if a bar graph would be more appropriate with the tasks on the x-axis and the amount of hours on the y-axis?@Sempervivum#1638561
09 September at 04:00am and resolution time took 2hours, how do i display total hours worked on this activity? yes if bar graph would be appropriate, although my first option was timeline
https://visjs.github.io/vis-timeline/examples/timeline/basicUsage.html
Then you need to specify` .@Sempervivum#1638563 yes but my issue is on the calculation of hours, so it can be shown. total hours spend on activity> Can anyone help on this?` ?@Sempervivum#1638571 end date of activity havent created, but i want this data to pulled from json file. i saw on this below example how they calling it using dataset manually.
https://github.com/visjs/vis-timeline/issues/663
Check if it fits your needs.
Regarding this calculation:
Do I understand it correctly: You intend to calculate the total amount of time spent for the task, taking into account business hours? E. g. business hours from 8:00 to 16:00, task took from Sept. 11 12:00 to Sept 13 14:00
1st day 4 hours
2nd day 8 hours
3rd day 6 hours
and sum it up. Is this correct?@Sempervivum#1638594
Correct i want this logic to be display there, exactly what you specify.
@Sempervivum#1638597
I inspect and picked up this bug
Define it this way and adjust the times.@Sempervivum#1638599 where is this function defined? like the order of them dont want mess up this logic with weird errors lol
@Sempervivum#1638602 It works, is it possible we can replace minutes with hours to make it more efficient? my thinking if users not familiar with minutes than hours. As they seem to understand hours more than minutes. What are your thoughts?
@Sempervivum#1638606 Thank you so much for your help, it does shows hours now than minutes and makes it easy for someone else to understand hours spend on that activity.
@Sempervivum#1638614 Thanks for mentioning this to me, because i was still looking at the logic now. because it is currently calculating hours as per month. This is confusing, it suppose to start look at the task worked on per that activity and day. let me modify, i believe this falls under else and if statement from the function......?
@Sempervivum#1638614 i have a question in mind, is it possible that total hours worked on be shown be day(shift)?
e.g Wilson took 2 hours on Management report, date 12 September 2021 and time 09:00-11:00am/pm
This is the only thing i need based on what we have if make sense.
Unfortunately I don't understand. It could be done easily when the task has been finished in one day. But what should happen when it takes several days? Output a list or table?Note that there is only a small rectangle in the timeline. When you require a list I would recommend making a tooltip which opens on click or mouseover.
How to use vis.min.js on your mvc 5 application?
Hi Team
I have installed vis.min.js libraries somehow i am getting a lot of errors such as below. Please view and issue is on View.cshtml and did inspect the element, this is error im getting
“`
 // Current issue
 vis.js:20107 Uncaught Error: Property “start” missing in item [object Object]
 at new o (vis.js:20107)
 at n.<anonymous> (vis.js:18462)
 at Array.forEach (<anonymous>)
 at n._onUpdate (vis.js:18439)
 at n.setItems (vis.js:18292)
 at o.setItems (vis.js:40905)
 at new o (vis.js:40826)
 at Object.ChartVis [as success] (Index:91)
 at fire (jquery-3.4.1.js:3291)
 at Object.fireWith [as resolveWith] (jquery-3.4.1.js:3421)
// View code
@model CheckTimeLine.Models.SelectOption
@{
ViewBag.Title = “Home Page”;
}
<h2>TimeLine</h2>
<!– CSS –>
@section scripts{
<!– CSS –>
<script src=”/vis/vis.min.js”></script>
<link href=”/Content/vis.min.css” rel=”stylesheet”/>
<script type=”text/javascript”>
$(document).ready(function () {
$.ajax({
type: “GET”,
url: “GetAll”,
contentType: “application/json; charset=utf-8”,
dataType: “json”,
success: ChartVis,
error: OnError
});
function ChartVis(response) {
// DOM element where the Timeline will be attached
var container = document.getElementById(‘visualization’);
// Create a DataSet (allows two way data-binding)
var items = new vis.DataSet(response);
// Configuration for the Timeline
var options = {};
// Create a Timeline
var timeline = new vis.Timeline(container, items, options);
}
function OnError(response) {
alert(“Error !”);
}
})
</script>
}
<div id=”visualization”></div>
Sign in
to post a comment48 Comments(s) ↴
0
@SempervivumOct 18.2021 — #Hi Magic2021,please use code tags when posting code:
your code hereI didn't know about vis.js till now but after having a short look at the docs and the examples I suspect that the element "start" is missing in your data. Obviously the timeline graph depends on it.
If this doesn't help, please post your json, a section containing a few elements would be sufficient.
reply?
0
@Magic2021authorOct 25.2021 — #reply?
0
@SempervivumOct 25.2021 — #reply?
0
@Magic2021authorOct 25.2021 — #reply?
0
@Magic2021authorOct 25.2021 — #``<i>
</i> public class HomeController : Controller
{
public TimeLineApplicationDBEntities2 _context = new TimeLineApplicationDBEntities2();
public ActionResult Index()
{
return View();
}
public JsonResult GetAll()
{
var data = _context.Application_CheckList.ToList();
return Json(data, JsonRequestBehavior.AllowGet);
}<i>
</i>``reply?
0
@SempervivumOct 25.2021 — #Please post some sample data.
reply?
0
@Magic2021authorOct 25.2021 — #reply?
0
@SempervivumOct 25.2021 — #There are several options to make the data visible. One is: Add a console.log in the callback und post what's getting visible in the console:``<i>
</i> function ChartVis(response) {
console.log(response);
// DOM element where the Timeline will be attached
var container = document.getElementById('visualization');
// Create a DataSet (allows two way data-binding)
var items = new vis.DataSet(response);
// Configuration for the Timeline
var options = {};
// Create a Timeline
var timeline = new vis.Timeline(container, items, options);
}<i>
</i> ``reply?
0
@Magic2021authorOct 25.2021 — #I am still getting same error, inspect it and getting same error. What could i be missing?
reply?
0
@SempervivumOct 25.2021 — #reply?
0
@Magic2021authorOct 25.2021 — #This what i get from the console
Description: "ShopFloor AMS Incident Report"
Incident: 1
Resources: "Racs"
Start_Date: "/Date(1631138400000)/"
Timestamp: "/Date(1632369600000)/"
id: "88b814cb-0a7c-4656-841e-77e3d7bd16da"
[[Prototype]]: Object
constructor: ƒ Object()
hasOwnProperty: ƒ hasOwnProperty()
isPrototypeOf: ƒ isPrototypeOf()
propertyIsEnumerable: ƒ propertyIsEnumerable()
toLocaleString: ƒ toLocaleString()
toString: ƒ toString()
valueOf: ƒ valueOf()
__defineGetter__: ƒ __defineGetter__()
__defineSetter__: ƒ __defineSetter__()
__lookupGetter__: ƒ __lookupGetter__()
__lookupSetter__: ƒ __lookupSetter__()
__proto__: (...)
get __proto__: ƒ __proto__()
set __proto__: ƒ __proto__()
1:
Description: "ShopFloor AMS Incident report"
Incident: 2
Resources: "Tracking Client"
Start_Date: "/Date(1631138467000)/"
Timestamp: "/Date(1631707200000)/"
id: "d781b787-a2e7-4a26-bf92-70f8aa797fde"
[[Prototype]]: Object``
reply?
0
@SempervivumOct 25.2021 — #I'm a bit confused now as, AFAIK, no functions can be encoded in a JSON response. To make shure, mark beginning and end of the data by two additional logs:``<i>
</i> function ChartVis(response) {
console.log('begin response');
console.log(response);
console.log('end response');
// DOM element where the Timeline will be attached
var container = document.getElementById('visualization');
// Create a DataSet (allows two way data-binding)
var items = new vis.DataSet(response);
// Configuration for the Timeline
var options = {};
// Create a Timeline
var timeline = new vis.Timeline(container, items, options);
}<i>
</i> ``reply?
0
@Magic2021authorOct 25.2021 — #output show begin response
> Array(2)
> 0: {Incident: 1, Description: 'ShopFloor AMS Incident Report', Resources: 'Racs', Start_Date: '/Date(1631138400000)/', Timestamp: '/Date(1632369600000)/', …}
> 1: {Incident: 2, Description: 'ShopFloor AMS Incident report', Resources: 'Tracking Client', Start_Date: '/Date(1631138467000)/', Timestamp: '/Date(1631707200000)/', …}
> length: 2
> [[Prototype]]: Array(0)
end response
reply?
0
@Magic2021authorOct 25.2021 — #reply?
0
@SempervivumOct 25.2021 — #reply?
0
@SempervivumOct 25.2021 — #I coded a rough version of the function ChartVis and it works for me:``<i>
</i> function ChartVis(response) {
// convert reponse to format being required by vis.js:
const data = response.map((item) => {
// parse Start_Date in order to get pure timestamp:
const parsed = item.Start_Date.match(//Date((d+))//);
// first attempt: create ISO date string, this was not necessary
// as vis.DataSet accepts the timestamp:
// const start = new Date(Number(parsed[1]));
// const startStr = start.toISOString();
// return record in format being required by timeline
return { id: item.Incident, start: Number(parsed[1]), content: item.Description };
});
console.log(data);
// DOM element where the Timeline will be attached
var container = document.getElementById('visualization');
// Create a DataSet (allows two way data-binding)
var items = new vis.DataSet(data);
// // Configuration for the Timeline
var options = {};
// // Create a Timeline
var timeline = new vis.Timeline(container, items, options);
}<i>
</i>``reply?
0
@Magic2021authorOct 25.2021 — #Thanks so much mate, you made my day, it does load the data without any issue. Will amend my local data fields from the database(extra fields like year and username) without having any issues. It works mate
reply?
0
@Magic2021authorOct 25.2021 — #reply?
0
@SempervivumOct 25.2021 — #I acted on the assumption that Start_Date contains the timestamp in milliseconds which seemed to be correct at first. Do you know about the real data, is this assumption correct? The Javascript shows the time that has been entered to the response on the server.For me the output of vis.js for the sample data you posted looks like this:
reply?
0
@Magic2021authorOct 25.2021 — #I checked on my local database, Start_Date record is datetime and did the same on model its datatype_. I do see on your output you have correct order of day and date, what could i be missing? Share your full vis js correctly took the newest one you posted. I could be missing some information.
reply?
0
@SempervivumOct 25.2021 — #>I do see on your output you have correct order of day and date, what could i be missing?
Does this mean that your page is displaying the graph in a different way? Maybe we are using different versions of vis.js. I included it from CDN, my complete test file is:
``<i>
</i><!DOCTYPE html>
<html>
<head>
<title>Data Visualisation By vis.js</title>
<meta name="viewport" content="width=device-width, initial-scale=1">
<script type="text/javascript" src="https://code.jquery.com/jquery-3.2.1.min.js"></script>
<link rel="stylesheet" href="https://cdnjs.cloudflare.com/ajax/libs/vis/4.21.0/vis-network.min.css"
integrity="sha512-NJXM8vzWgDcBy9SCUTJXYnNO43sZV3pfLWWZMFTuCtEUIOcznk+AMpH6N3XruxavYfMeMmjrzDMEQ6psRh/6Hw=="
crossorigin="anonymous" referrerpolicy="no-referrer" />
<link rel="stylesheet" href="https://cdnjs.cloudflare.com/ajax/libs/vis/4.21.0/vis.min.css"
integrity="sha512-8OVtKyemDe8Koi/74dnSJughhkwnzqq217zUtUumyvx0Z0kF6H0YYFobH2kEYjKMNq2xNQyN64dnleqecTSL0A=="
crossorigin="anonymous" referrerpolicy="no-referrer" />
<script src="https://cdnjs.cloudflare.com/ajax/libs/vis/4.21.0/vis.min.js"
integrity="sha512-XHDcSyqhOoO2ocB7sKOCJEkUjw/pQCJViP1ynpy+EGh/LggzrP6U/V3a++LQTnZT7sCQKeHRyWHfhN2afjXjCg=="
crossorigin="anonymous" referrerpolicy="no-referrer"></script>
<script src="https://cdnjs.cloudflare.com/ajax/libs/vis/4.21.0/vis-timeline-graph2d.min.js"
integrity="sha512-e7wHjGSu73zD0szO6qaOwIlpco3utvaPyHzjRVsgU34Hw+yzlPXcSC27jlL3ddg0csFbdrx67QWS8pyVVMX10w=="
crossorigin="anonymous" referrerpolicy="no-referrer"></script>
<style>
</style>
</head>
<body>
<div id="visualization"></div>
<script type="text/javascript">
$(document).ready(function () {
$.ajax({
type: "GET",
url: "thread758-visjs-webdev-3.json",
contentType: "application/json; charset=utf-8",
dataType: "json",
success: ChartVis,
error: OnError
});
function ChartVis(response) {
// convert reponse to format required by vis.js:
const data = response.map((item) => {
// parse Start_Date in order to get pure timestamp:
const parsed = item.Start_Date.match(//Date((d+))//);
// first attempt: create ISO date string, this was not necessary
// as vis.DataSet accepts the timestamp:
// const start = new Date(Number(parsed[1]));
// const startStr = start.toISOString();
// return record in format being required by timeline
return { id: item.Incident, start: Number(parsed[1]), content: item.Description };
});
console.log(data);
// DOM element where the Timeline will be attached
var container = document.getElementById('visualization');
// Create a DataSet (allows two way data-binding)
var items = new vis.DataSet(data);
// // Configuration for the Timeline
var options = {};
// // Create a Timeline
var timeline = new vis.Timeline(container, items, options);
}
function OnError(response) {
alert("Error !");
}
});
</script>
</body>
</html><i>
</i>`</CODE>
My JSON file:
<CODE>`<i>
</i>[
{
"Incident": 1,
"Description": "ShopFloor AMS Incident Report",
"Resources": "Racs",
"Start_Date": "/Date(1631138400000)/",
"Timestamp": "/Date(1632369600000)/"
},
{
"Incident": 2,
"Description": "ShopFloor AMS Incident report",
"Resources": "Tracking Client",
"Start_Date": "/Date(1631138467000)/",
"Timestamp": "/Date(1631707200000)/"
}
]<i>
</i>``reply?
0
@Magic2021authorOct 25.2021 — #reply?
0
@SempervivumOct 25.2021 — #The link on stackoverflow describes how to restrict the graph to business hours. Is this what you need?
reply?
0
@Magic2021authorOct 25.2021 — #I have tried to use this logic and was unable to achieve this result, perhaps i need your help on this one.
function ChartVis(response) {<br/>
// convert reponse to format being required by vis.js:<br/>
const data = response.map((item) => {<br/>
// parse Start_Date in order to get pure timestamp:<br/>
const parsed = item.Start_Date.match(//Date<ESC>(</ESC>(d+)<ESC>)</ESC>//);
<i> </i><CODE> // first attempt: create ISO date string, this was not necessary
<i> </i> // as vis.DataSet accepts the timestamp:
<i> </i> // const start = new Date(Number(parsed[1]));
<i> </i> // const startStr = start.toISOString();
<i> </i> // return record in format being required by timeline
<i> </i> return { id: item.Incident, start: Number(parsed[1]), content: item.Description };
<i> </i> });
<i> </i> console.log(data);
<i> </i> // DOM element where the Timeline will be attached
<i> </i> var container = document.getElementById('visualization');
<i> </i> var hours = document.getElementById("timeline");
<i> </i> var items = new vis.DataSet(data);
<i> </i> // sample entries
<i> </i> var s4Item = new vis.DataSet([{
<i> </i> id: 1,
<i> </i> content: 'ShopFlor AMS Incident Report',
<i> </i> start: '2021-09-15 03:00:00',
<i> </i> end: '2021-09-15 06:30:00'
<i> </i> }]);
<i> </i> // Create a DataSet (allows two way data-binding)
<i> </i>
<i> </i> // // Configuration for the Timeline
<i> </i> var options = {
<i> </i> // hide weekends - use any weekend and repeat weekly
<i> </i> hiddenDates: [{
<i> </i> start: '2021-08-04 00:00:00',
<i> </i> end: '2021-08-06 00:00:00',
<i> </i> repeat: 'weekly'
<i> </i> },
<i> </i> // hide outside of 9am to 5pm - use any 2 days and repeat daily
<i> </i> {
<i> </i> start: '2021-08-04 17:00:00',
<i> </i> end: '2021-08-05 09:00:00',
<i> </i> repeat: 'daily'
<i> </i> }
<i> </i> ],
<i> </i> // start and end of timeline
<i> </i> start: '2021-09-01',
<i> </i> end: '2021-09-30',
<i> </i> height: '140px',
<i> </i> editable: false
<i> </i> };
<i> </i> // // Create a Timeline
<i> </i> var timeline = new vis.Timeline(container, items, options);
<i> </i> }reply?
0
@SempervivumOct 25.2021 — #>I want to implement total hours worked on a given task to be display on UI
This I understand. However more questions arise: What date and time should be used when the work is distributed over some days? Note that the timeline graph depends on the field
start`reply?
0
@Magic2021authorOct 25.2021 — #09 September at 04:00am and resolution time took 2hours, how do i display total hours worked on this activity? yes if bar graph would be appropriate, although my first option was timeline
reply?
0
@SempervivumOct 25.2021 — #Do you mean something like this example, item4 with a bar from start to end?Then you need to specify
end</C> additionally, if duration is available you can easily calculate <C>end</C> by adding duration to <C>start`reply?
0
@Magic2021authorOct 25.2021 — #reply?
0
@SempervivumOct 25.2021 — #Is end date of the activity available in the data? Is it the field Timestamp`reply?
0
@Magic2021authorOct 26.2021 — #reply?
0
@SempervivumOct 26.2021 — #I used Timestamp as the end time and coded this:``<i>
</i> function ChartVis(response) {
// get timestamp from string:
function getTime(timeStr) {
const parsed = timeStr.match(//Date((d+))//);
return Number(parsed[1]);
}
// convert reponse to format required by vis.js:
const data = response.map((item) => {
// return record in format being required by timeline
return {
id: item.Incident,
start: getTime(item.Start_Date),
end: getTime(item.Timestamp),
content: item.Description
};
});
console.log(data);
// DOM element where the Timeline will be attached
var container = document.getElementById('visualization');
// Create a DataSet (allows two way data-binding)
var items = new vis.DataSet(data);
// // Configuration for the Timeline
var options = {};
// // Create a Timeline
var timeline = new vis.Timeline(container, items, options);
}<i>
</i>``Check if it fits your needs.
Regarding this calculation:
>my issue is on the calculation of hours, so it can be shown. total hours spend on activity
Do I understand it correctly: You intend to calculate the total amount of time spent for the task, taking into account business hours? E. g. business hours from 8:00 to 16:00, task took from Sept. 11 12:00 to Sept 13 14:00
1st day 4 hours
2nd day 8 hours
3rd day 6 hours
and sum it up. Is this correct?
reply?
0
@Magic2021authorOct 26.2021 — #Correct i want this logic to be display there, exactly what you specify.
reply?
0
@SempervivumOct 26.2021 — #I extended the function ChartVis, check if it fits your needs. Note that I didn't test this in detail, please do this on your own.``<i>
</i> function ChartVis(response) {
// get timestamp from string:
function getTime(timeStr) {
const parsed = timeStr.match(//Date((d+))//);
return Number(parsed[1]);
}
// get minutes from time related to start of day:
function getMinutes(timeStamp) {
dat = new Date(timeStamp);
return dat.getHours() * 60 + dat.getMinutes();
}
// calculate diff in days according to
// https://stackoverflow.com/questions/3224834/get-difference-between-2-dates-in-javascript
const _MS_PER_DAY = 1000 * 60 * 60 * 24;
// a and b are javascript Date objects
function dateDiffInDays(a, b) {
// Discard the time and time-zone information.
const utc1 = Date.UTC(a.getFullYear(), a.getMonth(), a.getDate());
const utc2 = Date.UTC(b.getFullYear(), b.getMonth(), b.getDate());
return Math.floor((utc2 - utc1) / _MS_PER_DAY);
}
// get minutes for business times:
for (key in businessTime) {
const splitted = businessTime[key].split(':');
businessTime[key + 'Minutes'] = parseInt(splitted[0]) * 60 + parseInt(splitted[1]);
}
businessTime.minutesOneDay = businessTime.endMinutes - businessTime.startMinutes;
console.log(businessTime);
// calculate amount of time
const data = response.map((item) => {
const
startTimestamp = getTime(item.Start_Date),
endTimestamp = getTime(item.Timestamp);
// from here we are using minutes related to the start of the day
let
startMinutes = getMinutes(startTimestamp),
endMinutes = getMinutes(endTimestamp);
if (startMinutes < businessTime.startMinutes) {
startMinutes = businessTime.startMinutes;
}
if (endMinutes > businessTime.endMinutes) {
endMinutes = businessTime.endMinutes;
}
// calculate total time the task took
const
// calculate amount on first day:
amountFirstDay = businessTime.endMinutes - startMinutes,
// calculate amount on last day:
amountLastDay = endMinutes - businessTime.startMinutes;
// get difference in days between first and last day:
diffDays = dateDiffInDays(new Date(startTimestamp), new Date(endTimestamp));
let totalMinutes;
// did the task take more than one day?
if (diffDays > 0) {
totalMinutes = amountFirstDay + diffDays * businessTime.minutesOneDay + amountLastDay;
} else {
// task took one day only:
totalMinutes = endMinutes - startMinutes;
}
console.log(totalMinutes);
// return record in format being required by timeline
return {
id: item.Incident,
start: startTimestamp,
end: endTimestamp,
content: item.Description + '<br>Took ' + totalMinutes + ' minutes'
};
});
console.log(data);
// DOM element where the Timeline will be attached
var container = document.getElementById('visualization');
// Create a DataSet (allows two way data-binding)
var items = new vis.DataSet(data);
// // Configuration for the Timeline
var options = {};
// // Create a Timeline
var timeline = new vis.Timeline(container, items, options);
}<i>
</i>``reply?
0
@Magic2021authorOct 26.2021 — #I inspect and picked up this bug
``<i>
</i>Index:105 Uncaught ReferenceError: businessTime is not defined
at Object.ChartVis [as success] (Index:105)
at fire (jquery-3.4.1.js:3291)
at Object.fireWith [as resolveWith] (jquery-3.4.1.js:3421)
at done (jquery-3.4.1.js:9533)
at XMLHttpRequest.<anonymous> (jquery-3.4.1.js:9785)<i>
</i>``reply?
0
@SempervivumOct 26.2021 — #I see, sorry, I forgot that I defined businessTime outside the function:``<i>
</i> const businessTime = {
start: '8:00',
end: '16:00'
}<i>
</i>``Define it this way and adjust the times.
reply?
0
@Magic2021authorOct 26.2021 — #reply?
0
@SempervivumOct 26.2021 — #You can place it at the beginning:``<i>
</i> <script type="text/javascript">
$(document).ready(function () {
const businessTime = {
start: '8:00',
end: '16:00'
}
$.ajax({
type: "GET",
url: "thread758-visjs-webdev-3.json",
contentType: "application/json; charset=utf-8",
dataType: "json",
success: ChartVis,
error: OnError
});
function ChartVis(response) {
// and so on<i>
</i>``reply?
0
@Magic2021authorOct 26.2021 — #reply?
0
@SempervivumOct 26.2021 — #Yes, that's easy, I assumed that you you could change this on your own. I changed the function ChartVis: ``<i>
</i> function ChartVis(response) {
// get timestamp from string:
function getTime(timeStr) {
const parsed = timeStr.match(//Date((d+))//);
return Number(parsed[1]);
}
// get minutes from time related to start of day:
function getMinutes(timeStamp) {
dat = new Date(timeStamp);
return dat.getHours() * 60 + dat.getMinutes();
}
// calculate diff in days according to
// https://stackoverflow.com/questions/3224834/get-difference-between-2-dates-in-javascript
const _MS_PER_DAY = 1000 * 60 * 60 * 24;
// a and b are javascript Date objects
function dateDiffInDays(a, b) {
// Discard the time and time-zone information.
const utc1 = Date.UTC(a.getFullYear(), a.getMonth(), a.getDate());
const utc2 = Date.UTC(b.getFullYear(), b.getMonth(), b.getDate());
return Math.floor((utc2 - utc1) / _MS_PER_DAY);
}
// get minutes for business times:
for (key in businessTime) {
const splitted = businessTime[key].split(':');
businessTime[key + 'Minutes'] = parseInt(splitted[0]) * 60 + parseInt(splitted[1]);
}
businessTime.minutesOneDay = businessTime.endMinutes - businessTime.startMinutes;
console.log(businessTime);
// calculate amount of time
const data = response.map((item) => {
const
startTimestamp = getTime(item.Start_Date),
endTimestamp = getTime(item.Timestamp);
// from here we are using minutes related to the start of the day
let
startMinutes = getMinutes(startTimestamp),
endMinutes = getMinutes(endTimestamp);
if (startMinutes < businessTime.startMinutes) {
startMinutes = businessTime.startMinutes;
}
if (endMinutes > businessTime.endMinutes) {
endMinutes = businessTime.endMinutes;
}
// calculate total time the task took
const
// calculate amount on first day:
amountFirstDay = businessTime.endMinutes - startMinutes,
// calculate amount on last day:
amountLastDay = endMinutes - businessTime.startMinutes;
// get difference in days between first and last day:
diffDays = dateDiffInDays(new Date(startTimestamp), new Date(endTimestamp));
let totalMinutes;
// did the task take more than one day?
if (diffDays > 0) {
totalMinutes = amountFirstDay + diffDays * businessTime.minutesOneDay + amountLastDay;
} else {
// task took one day only:
totalMinutes = endMinutes - startMinutes;
}
console.log(totalMinutes);
// convert amount of time to hours:minutes
let min = totalMinutes % 60;
if (min < 10) min = '0' + min;
const hours = Math.floor(totalMinutes / 60),
totalHours = '' + hours + ':' + min;
console.log(totalHours);
// return record in format being required by timeline
return {
id: item.Incident,
start: startTimestamp,
end: endTimestamp,
content: item.Description + '<br>Took ' + totalHours + ' hours'
};
});
console.log(data);
// DOM element where the Timeline will be attached
var container = document.getElementById('visualization');
// Create a DataSet (allows two way data-binding)
var items = new vis.DataSet(data);
// // Configuration for the Timeline
var options = {};
// // Create a Timeline
var timeline = new vis.Timeline(container, items, options);
}<i>
</i> ``reply?
0
@Magic2021authorOct 26.2021 — #reply?
0
@SempervivumOct 26.2021 — #There was still an error at calculation the total amount. E. g. diffDays is 1 then nothing has to be added but only start day and end day has to be included. Change the code to this:``<i>
</i> // did the task take more than one day?
if (diffDays > 0) {
totalMinutes = amountFirstDay + (diffDays - 1) * businessTime.minutesOneDay + amountLastDay;
} else {
// task took one day only:
totalMinutes = endMinutes - startMinutes;
}<i>
</i>``reply?
0
@Magic2021authorOct 26.2021 — #e.g Wilson took 2 hours on Management report, date 12 September 2021 and time 09:00-11:00am/pm
This is the only thing i need based on what we have if make sense.
reply?
0
@SempervivumOct 26.2021 — #>i have a question in mind, is it possible that total hours worked on be shown be day(shift)?
e.g Wilson took 2 hours on Management report, date 12 September 2021 and time 09:00-11:00am/pm
This is the only thing i need based on what we have if make sense.
Unfortunately I don't understand. It could be done easily when the task has been finished in one day. But what should happen when it takes several days? Output a list or table?
reply?
0
@SempervivumNov 02.2021 — #reply?